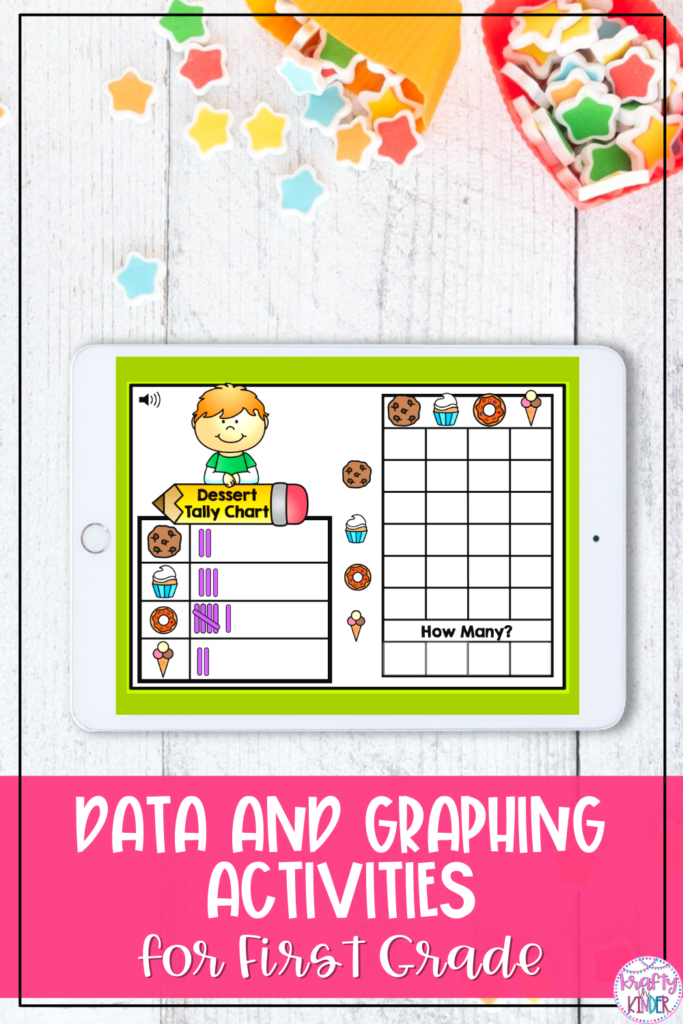
Data and Graphing Activities for First Grade
I love teaching my students all about data and graphing. This is such a fun lesson in kindergarten, first, or even second-grade classrooms! I like to approach this topic from a variety of angles with lots of different activities. If you’re getting ready to dive into data and graphing with your kiddos, I’ve got just the thing!
Data and Graphing Learning Goals
Before we begin, it’s important to note what we’re hoping to achieve with data and graphing activities in our classroom. When it comes to teaching kinder, 1st, or 2nd grade there are a few key things we want our kiddos to be able to walk away with after our lesson. When working with data students should be able to:
- organize data
- represent it with graphs
- analyze and interpret data by looking at their graph
Keeping these three goals in mind is crucial to ensuring your students will get the most out of each lesson. If you can hit on all of these outcomes, you’re in good shape for a solid understanding of data and graphing!
Getting Started with Data and Graphing
In my classroom, I always introduce a new topic with a whole group lesson. Teaching my whole group allows me to provide a general overview to my class all at once and also allows for some community-building time as well. I love when children discuss the topic with their partners and ask questions. To start off, I like to use my Data and Graphing Boom Cards as an example on the Smart Board.
Whole Group Teaching
To begin, I pull up one of the cards in the deck on the board and talk to my students about what we see in the box. For example, on this “pirate data” card, we notice that inside the box there are three different types of pictures (ships, maps, and telescopes). I explain to the kiddos that this is our data. I provide a simple definition of this word such as, “Data is information we collect about a topic or situation. It can be facts, observations, numbers, graphs, or measurements. In today’s lesson, we’re going to count how many of each picture there are to show our data in numbers and pictures.”
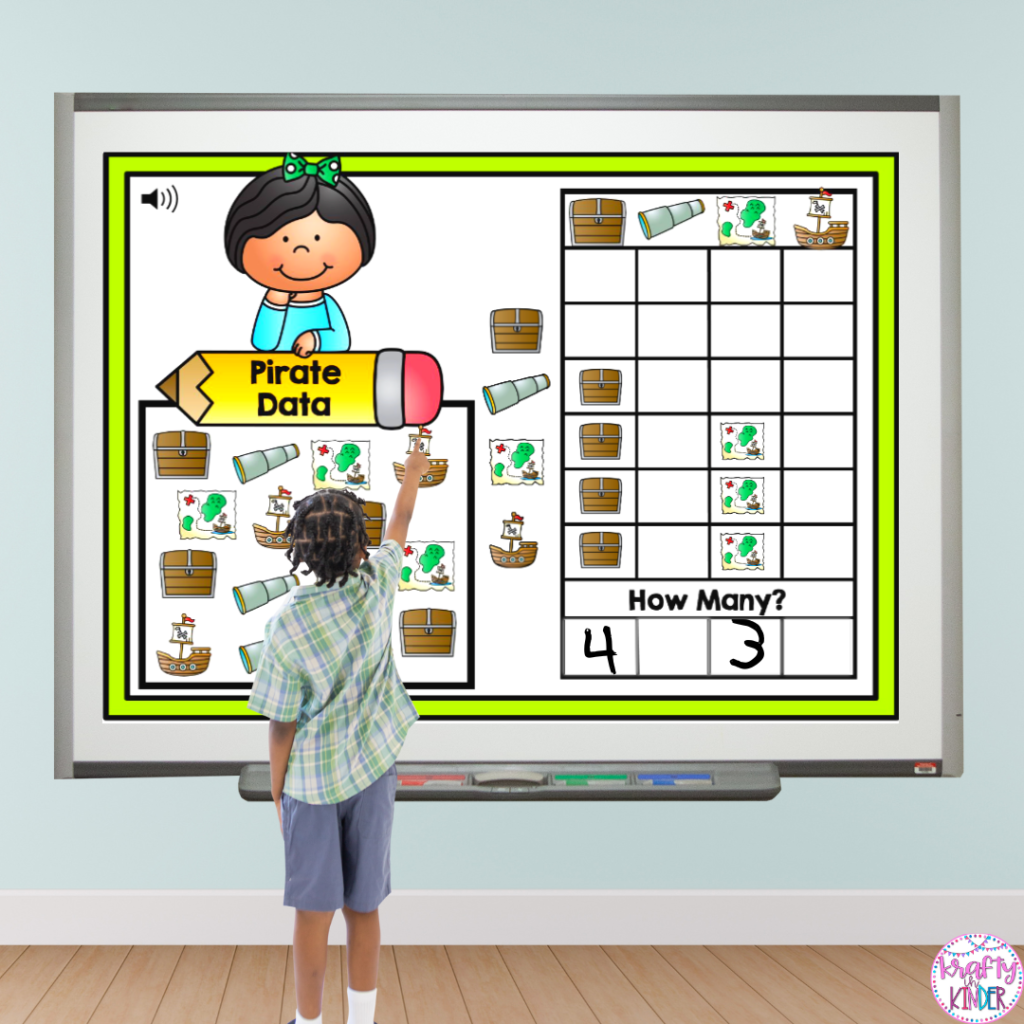
Then, I point to the graph and say that we will show our data using a graph. I explain that a graph is a picture that helps us organize the data and understand how many of each item we have.
Today’s graph will be a “picture graph”, meaning that we’ll drag pictures into each column to show how many of each item there are. After this quick intro, I use this card as an example to show the students how this works.
I call on students one at a time to count each item. Once we have our number, that student will drag the pictures into the graph to show how many. We pause and note that this is called organizing the data.
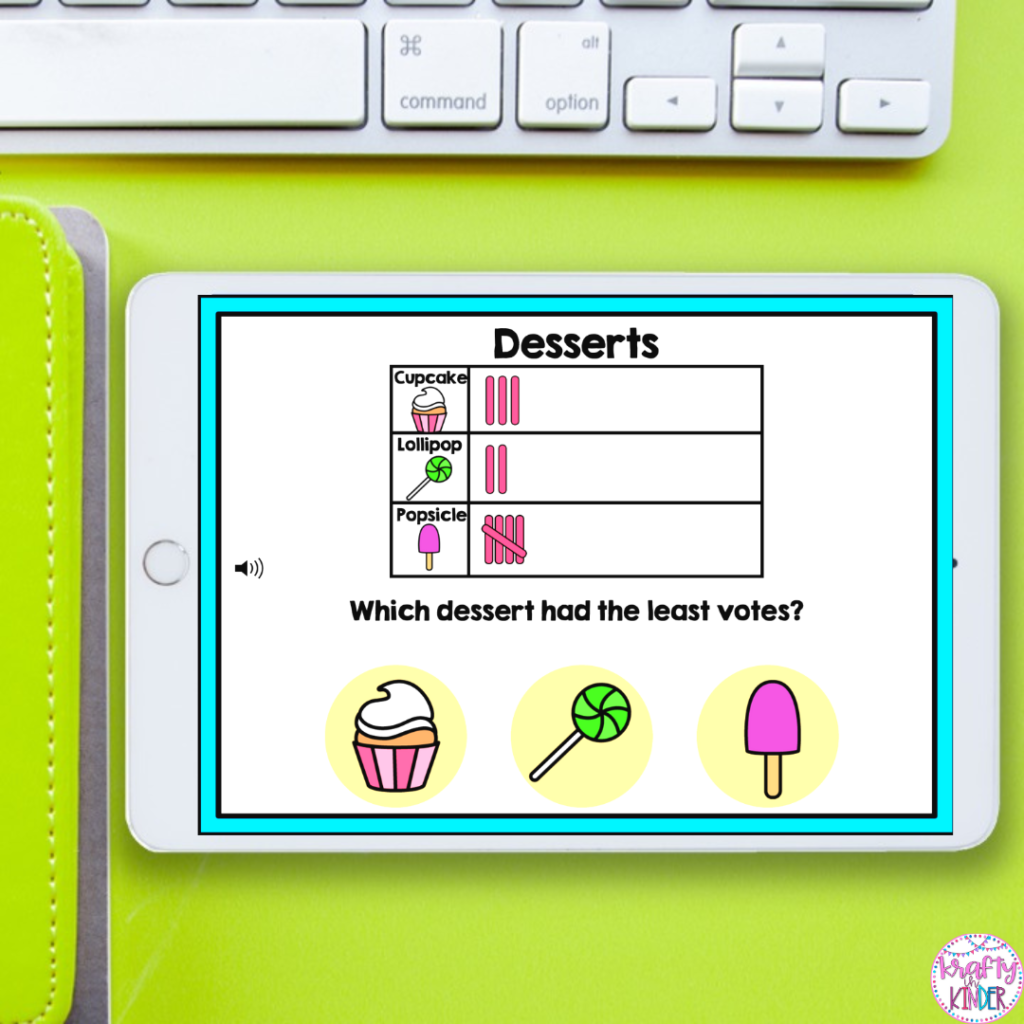
Then, we type the number to represent the data. We repeat this for each picture and then finally I call on volunteers to help me interpret the data. I ask questions like, “Which picture has the most?” and “Which picture has the least?”.
Lesson Takeaways
Our whole-group lesson is an opportunity to discuss what graphs can tell us about our data and why they might be useful in our everyday life. I like to use examples like counting snacks to see what we have available to share with friends or organizing our art supplies to see what we need to buy for a new school year. These real-life examples are always fun for my kiddos and get them excited to learn more about data and graphing.
More Ways to Practice
In addition to the Boom Card example, I like to use paper anchor charts and hands-on learning activities as well. To do this, I simply draw a quick graph on chart paper and grab a mix of items we can use as our data. You can use literally anything for this, but I tend to choose things like manipulatives. I’ll grab a few snap cubes, a few Legos, and a few pattern blocks.

Then, I’ll dump them all out on the carpet or table and call on one student at a time to count how many of one item. First, we use tally marks as they count to keep track of how many. Then another student will color in squares on our big graph to show how many of each. We repeat for each of the objects. Once we are done counting and graphing then we interpret our graph as a class to see what we can learn about the items.
This can be repeated with just about anything and is a great way to give students some practice with data and graphing in a fun, hands-on way. You can use a variety of items, but here are some of my go-to’s:
- different colored snap cubes
- different colored markers or crayons
- classroom manipulatives
- snacks like cereal, crackers, and pretzels
- books by theme
No matter what you choose as your data for your graph, just make sure to try this activity a few times as a whole group and in small groups. You can easily add a daily graphing activity to your circle time. This is a great way for student to grasp the concepts and get the practice they need. It can also be fun to pair up students and have them work on their own graph as well!
Data and Graphing Activities for Center Time
Once my students have had a chance to observe and practice graphing in whole group and small group centers, I’m a big fan of letting them practice independently. In my classroom, this means individual center time! When it comes to centers, I love using Boom Cards for a number of reasons.
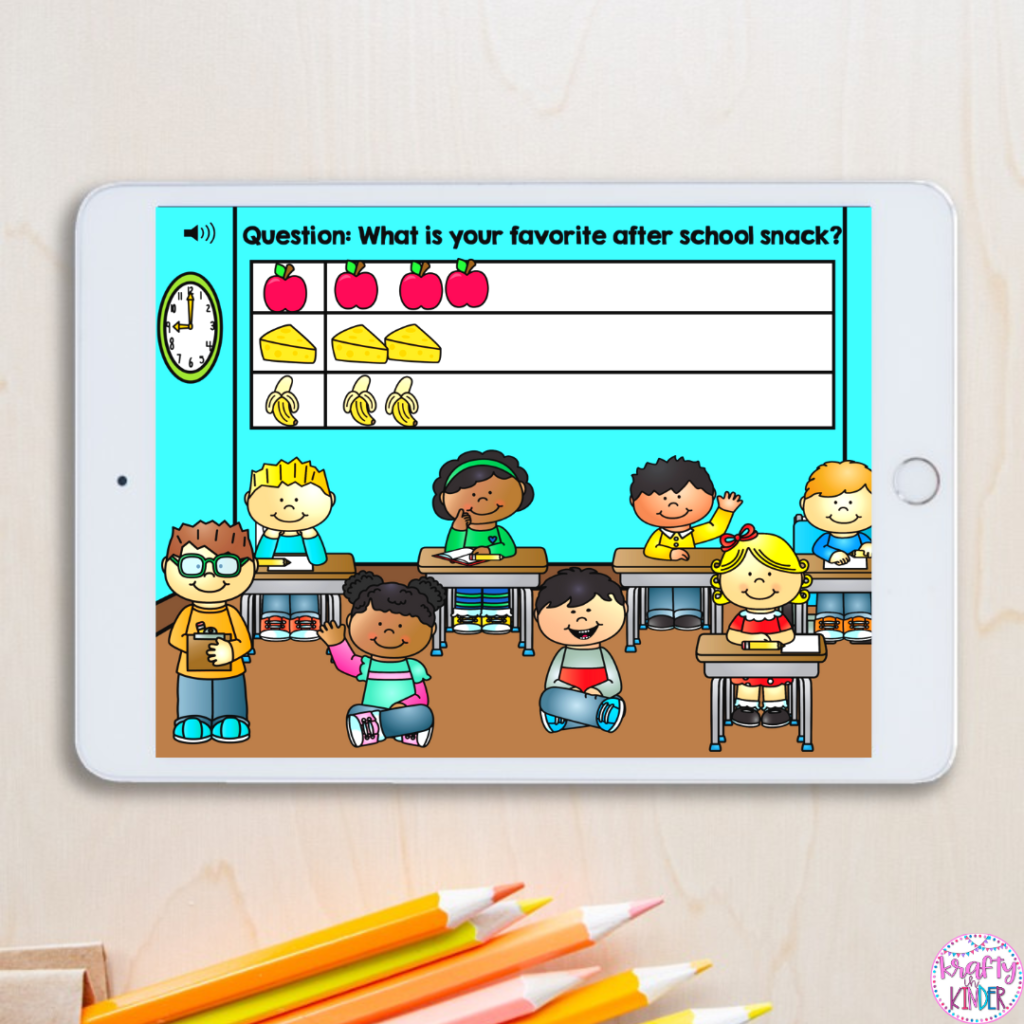
Boom Cards are perfect for young students who are just learning to read since they come with audio instructions. All my kiddos need to do is click the speaker on the card and the directions will be read aloud.
Boom cards are also super interactive. On each card, kiddos will count their data, drag and drop to the correct boxes and type out their answers just as we did in our whole group lesson. Boom cards are also self-checking, which means my kiddos will know right away if they answered incorrectly.
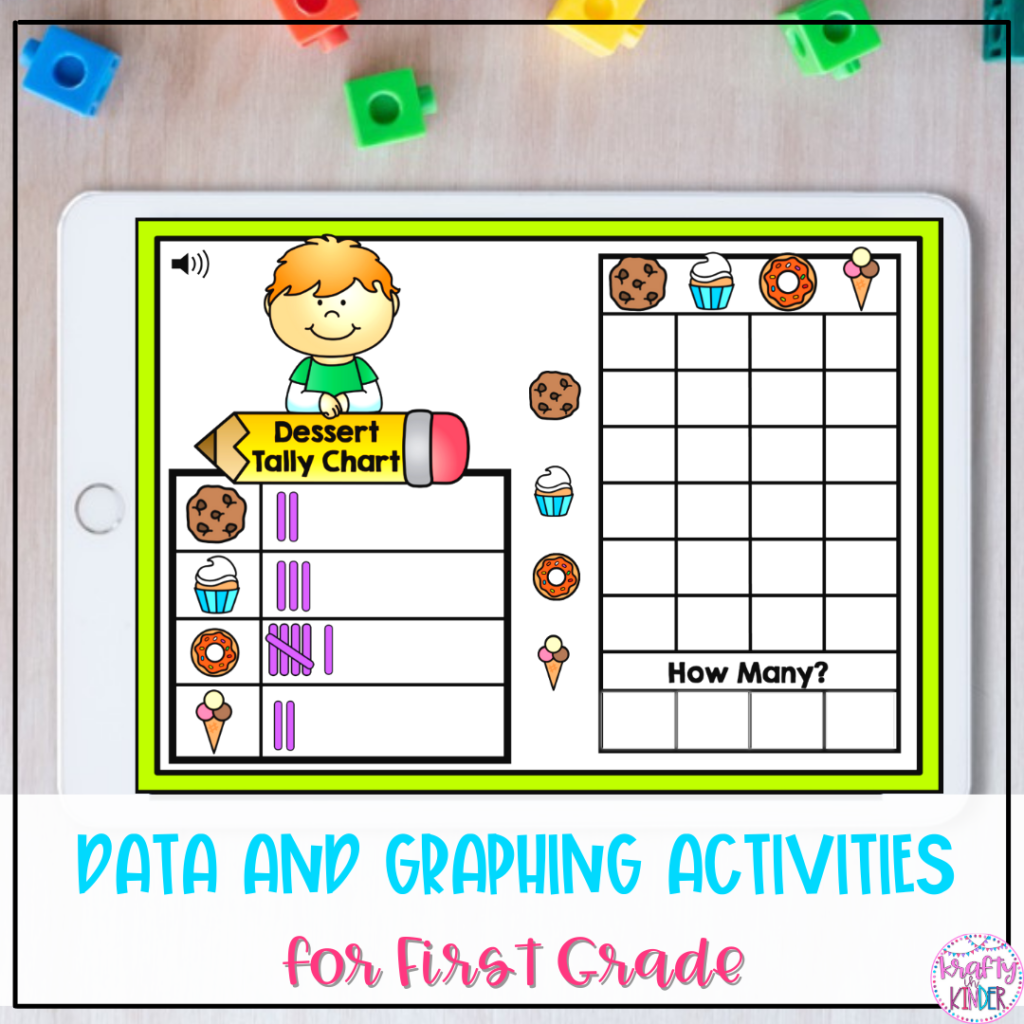
The Data and Graphing Boom Cards we use focus on picture graphs as well as tally marks. Boom cards can be used on iPads, laptops, tablets, Smart Boards, and desktop computers too! These versatile cards are a great way to get plenty of practice with data and graphing during center time.
There are 15 cards in this deck and they feature a variety of fun themes that my students love like pirates, favorite foods, and desserts! I found that these fun themes on the interactive Boom cards help keep engagement high and students on task during centers. I also like to assign these as homework for even more practice at home.
More Data and Graphing Activities
Working with data and learning to analyze and interpret it is a key concept in primary classrooms.
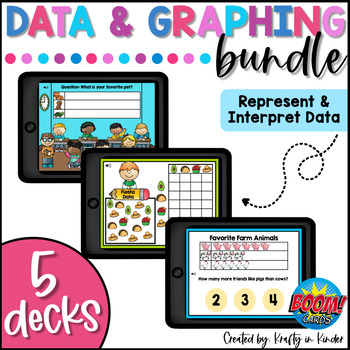
Since we work on this throughout the year, I made a whole bunch of other fun Boom Card activities to target these skills. In my Data and Graphing Boom Card Bundle kiddos will focus on:
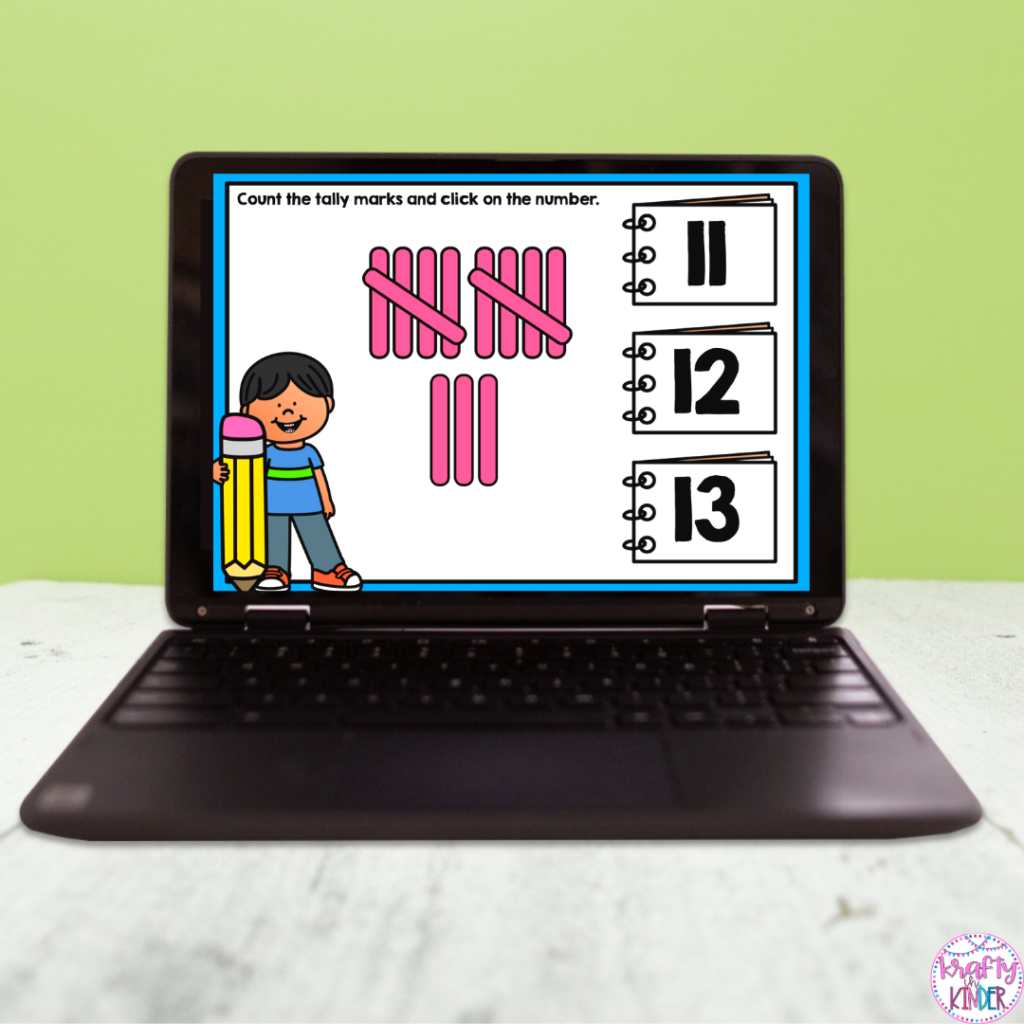
- Tally Marks 1-20
- Tally Marks 10-30
- Collecting, Graphing, and Analyzing Data
- Representing and Analyzing Data
This bundle of 5 boom card decks is a great way to target multiple data and graphing skills in a fun way. Each of the Boom card decks in this bundle was created with our young learners in mind.
The audio directions and simple tasks make them easy for young students to complete independently.
Use them during centers, whole-group teaching, small-group intervention, as a fast-finisher activity, or even homework. They are great to add to sub plans too! Students will love the interactive cards, and you’ll love the paperless, no-prep practice!
If you want to try one of these Boom card decks with your kiddos, make sure to download this freebie! It focuses on Tally Marks for numbers 10-30. This activity is a great way to get your kiddos working with data and see how Boom cards work in your classroom!
Save This Post
Not ready for data and graphing activities yet? Pin this post on Pinterest so you don’t lose it!